Crossover Point Report
This is an experimental feature. That means we’re still working on finishing it. There may be bugs, missing functionality or incomplete documentation, and we may decide to remove the feature in a future release. If you have any feedback, please open an issue or post a message in the Discord.
The Crossover Point Report is a financial planning tool inspired by the "Your Money or Your Life" methodology. This report helps users visualize when their passive income from investments will be sufficient to cover their projected expenses, marking the point where they achieve financial independence.
Input Parameters
The crossover point report requires four key inputs to generate projections:
| Parameter | Description | Details |
|---|---|---|
| Expense Categories | Specify which Actual Budget categories are expenses that will continue beyond retirement | Used to project expenses into the future to determine when passive income will cover living expenses. Exclude categories that won't persist beyond financial independence (e.g., retirement savings contributions, work-related expenses). |
| Income Accounts | Select accounts to include when calculating passive income | Include retirement accounts (401k, IRA, etc.) and investment accounts. Exclude accounts not used for retirement funding (e.g., children's education accounts). |
| Safe Withdrawal Rate | Annual percentage of portfolio to withdraw for living expenses | Default: 4% (based on "The 4% Rule" from Trinity Study, 1998). Adjust based on risk tolerance and asset allocation. More info |
| Expense Projection Type | Method for projecting future expenses from historical data | Linear Trend: Simple linear projection. Can project to unrealistically high or low expense levels when there is limited data, or large variances month to month. Hampel Filtered Median: Uses a Hampel test to filter out outlier monthly expenses. Then calculates the median amount from the remaining months and projects it into the future. |
| Estimated Return (Optional) | Anticipated annual rate of return for Income Accounts | Varies based on asset allocation and risk tolerance. If not provided, calculates historical return based on the change in Income Account balance over time. Note: The historical calculation includes contributions, which can inflate the rate of return. |
How It Works
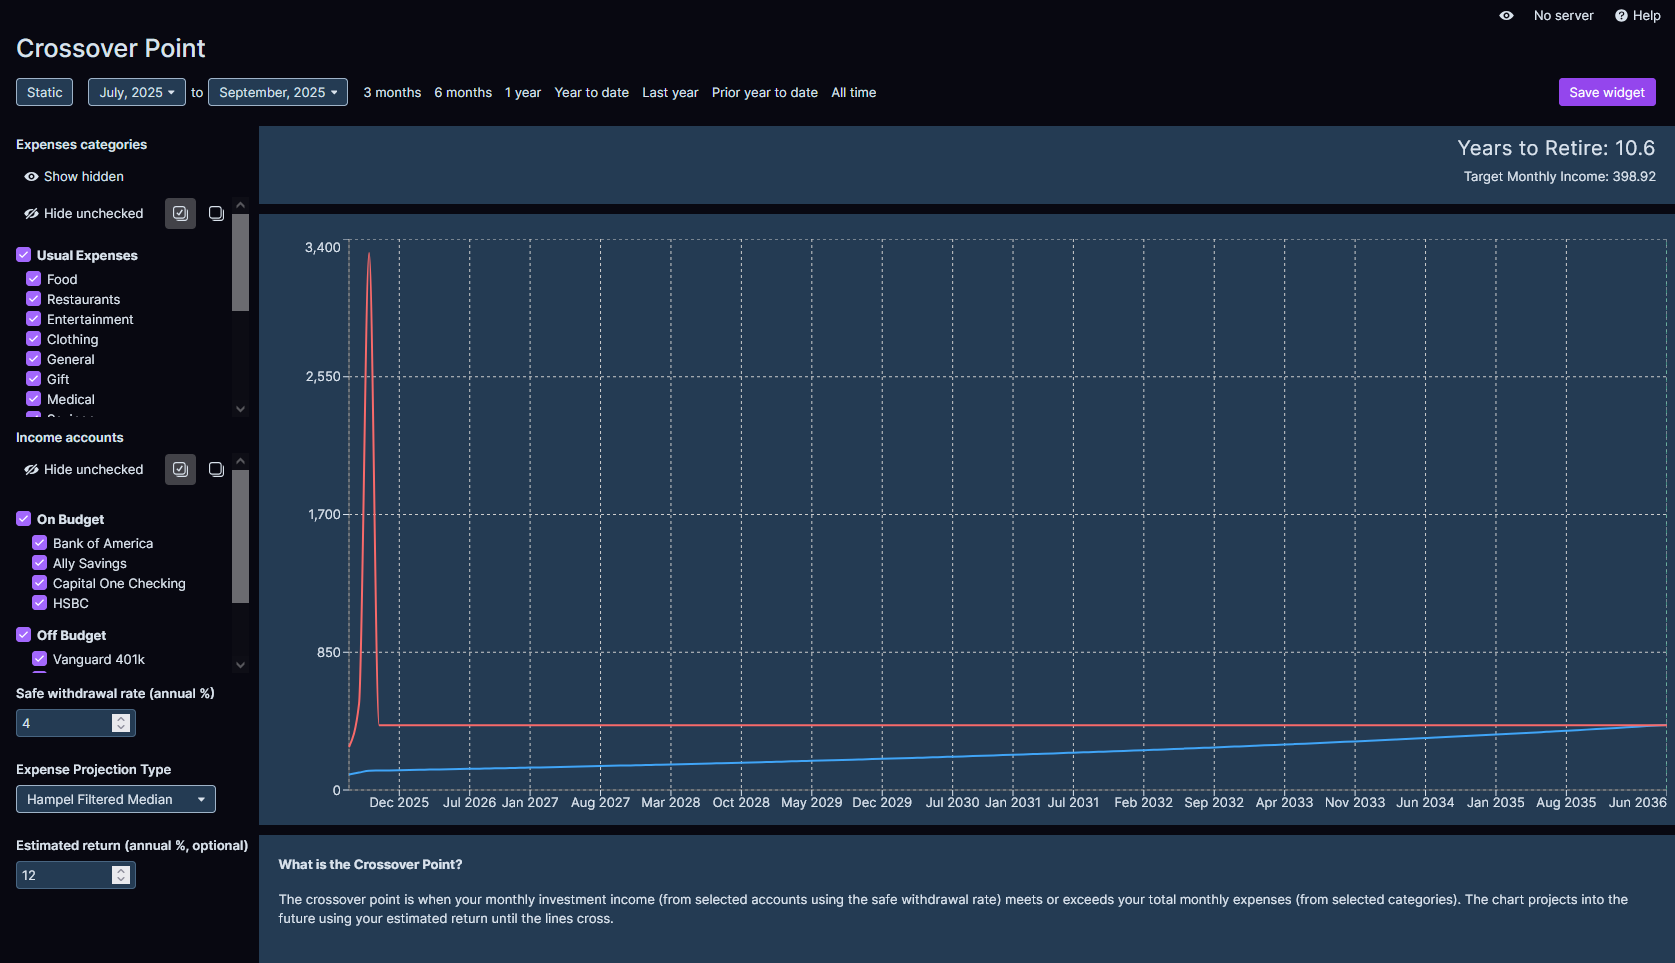
Based on your selected Expense Categories and Expense Projection Type, the chart will project your expenses into the future.
Based on your selected Income Accounts, Estimated Return, and Safe Withdrawal Rate, the chart will project your passive income into the future.
When the passive income grows to exceed the projected expenses, you've achieved financial independence!